Using data to communicate about community health
Improving data quality and enhancing potential users’ ability to collect analyse and apply data has been central to the USAID SQALE approach to quality improvement. In this session at the 2019 Learning Event participants fed back on what formats and mechanisms have been most useful and what more could be done.
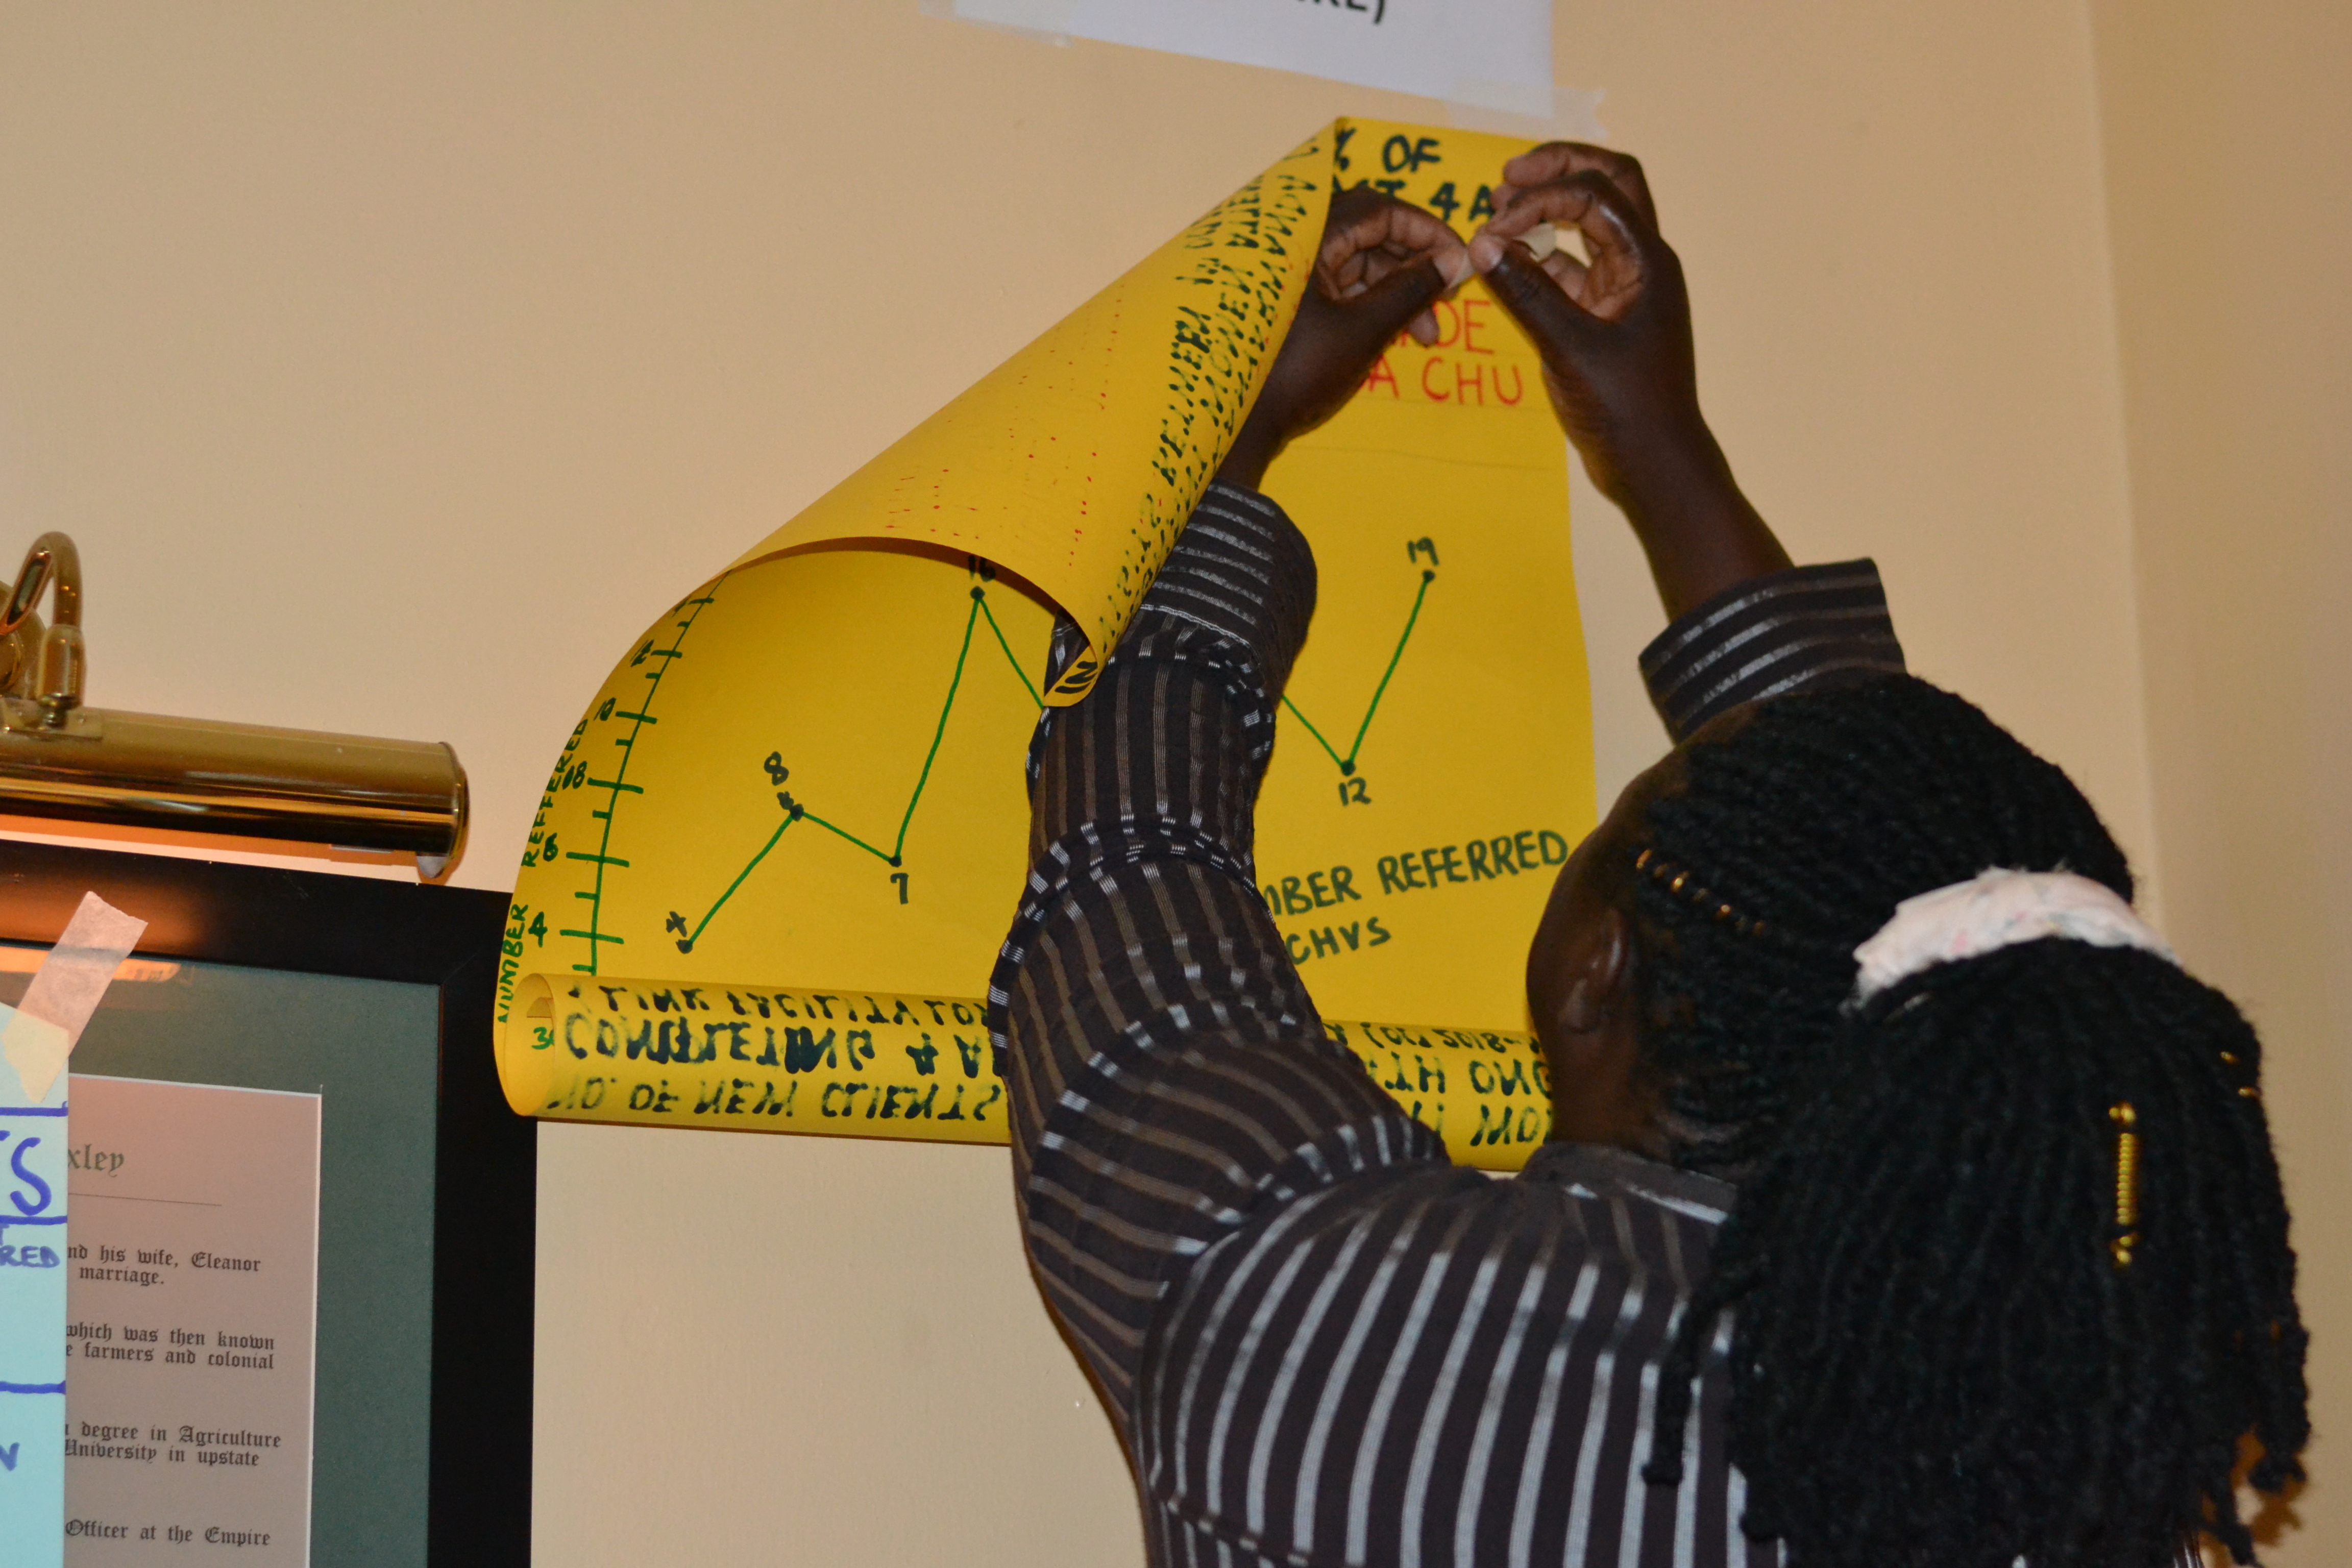
Participants felt that useful formats to display the data generated through USAID SQALE have included bar charts, line graphs, pie charts, reporting tools and maps. On the whole, CHVs considered bar and line charts more helpful as they are easier to draw and interpret.
Participants have communicated their data through monthly data reviews where the findings and data quality are assessed. Data is also used in performance reviews during support supervision by county and sub-county teams. Dialogue days and action days give a platform to share ideas of the findings with the community while talking walls and chalkboards that show data generated from the community and the facility can be used to indicate the success or failure of the facility and shows progress to the community.
Different communication approaches were taken depending on the audience. With CHVs participants tended to use graphs, group discussions and poster presentations. With the community a combination of group discussions, chalk boards, posters, support groups (mother to mother) and chiefs’ barazas were found to be effective. Outside stakeholders were provided with data in the form of graphs, monthly community data from MOH 514 and MOH 515, posters and DHIS reporting. While in a supervisory relationship the DHIS, DQA and monthly and quarterly reports were found to be important.
The data that has been collected through USAID SQALE has been presented in a variety of meetings including:
- CHS meetings
- Stakeholder meetings
- Sub-county WIT meetings
- Dialogue and Action days
- Chiefs’ barazas
- Data supervision meeting
- Annual health work plan meeting
- Annual Work Planning meetings
These communication mechanisms and fora could be strengthened by greater involvement of community level actors at the county and national level so that their voices are heard, and their feedback is acted on.
Participants would like to use map colorization via the GIS, scorecards, run charts, present DHIS data in different formats but these would require further capacity development.